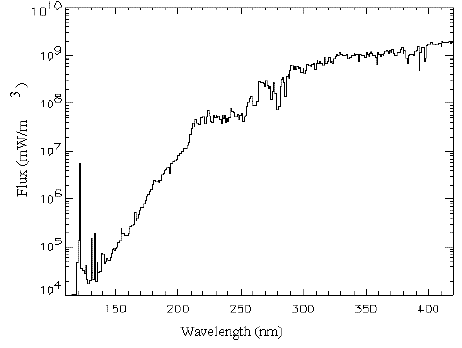
Figure 2 shows the ultraviolet portion of the solar spectrum from 120 to 420 nm that extends the data of Figure 1 (note that 109 mW m-3 of Figure 2 corresponds to 103 mW m-2 nm-1 of Figure 1). This spectrum has been integrated to 1 nm spectral bins (effective resolution of 1 nm) but quite adequately illustrates the structure in the spectrum: the Fraunhofer absorption lines illustrated by the Mg II doublet near 280 nm, the typical absorption edges seen for example at 208 nm due to Al I, and the conversion to an emission line spectrum at the shortest wavelengths - notably Lyman alpha at 122 nm. In this spectral range we comment on these various features, for they become quite apparent when we examine solar variability discussed in the next section.

FIGURE 2:The solar ultraviolet irradiance from 120 to 420 nm at 1 nm effective spectral resolution.
The very shortest wavelengths, the extreme ultraviolet and X-rays, are not considered specifically in this discussion. This high-energy portion of the solar spectrum is dominated by emission lines originating in the solar transition region and corona, and as such it is highly variable. In the context of TSI - it is negligible, in the context of the Earth's atmosphere - it is especially important to the thermosphere and ionosphere above 100 km, in the context of stellar connections - it is of special relevance down to the Lyman edge at 91 nm and at the very short wavelengths where the interstellar medium once again becomes transparent. Unfortunately observation of the EUV Sun are quite sparse, especially during the past twenty years. AE-E (Hinteregger et al. 1981) observed the Sun from 1977 to 1981, but other than a few sounding rockets and the short duration San Marco satellite, no further observations have been forthcoming. This gap in the data set and in our knowledge of the Sun will be addressed by the SEE instrument (Woods, et al. 1994) to be flown on the TIMED mission with a launch in the year 2000. The Yohkoh satellite has provided irradiance observations at 4 to 40 A since mid-1991 (Acton, 1996) and recent SOHO observations will provide limited irradiance measurements from late 1995 forward.
The longer wavelength spectrum of the Sun, in particular the spectral interval 120 to 400 nm, is now quite well studied. A number of instruments have provided, and continue to provide, spectra similar to that shown in Figure 2. Solar Backscatter Ultraviolet Instruments, SBUV, have been flow continuously since late 1978, first on the Nimbus-7 satellite and subsequently on a number of NOAA satellites (Cebula et al. 1994). These instruments operate in the spectral range 160 to 400 nm with a spectral resolution of about 1 nm. The Solar Mesosphere Explorer (SME) operated from 1981 through early 1989 and covered the spectral range 120 to 300 nm with a spectral resolution of 0.75 nm. More recently two instruments have operated on the Upper Atmosphere Research Satellite (UARS) since 1991. These two instruments, the Solar Ultraviolet Spectral Irradiance Monitor, SUSIM (Brueckner, et al. 1993) and the Solar Stellar Irradiance Comparison Experiment, SOLSTICE, (Rottman et al. 1993), have provided continuous coverage in the spectral range 120 to 420 nm with a spectral resolution varying from 0.1 to 1 nm. The GOME instrument on the European ERS-2 spacecraft (ESA, GOME Users Maual, 1995) has been operational since mid-1995, and covers the spectral range 240 nm all the way to 790 nm.
Woods et al. (1996) provide a very detailed comparison and validation of simultaneous observations obtained on two separate occasions by four separate instruments, the two on UARS and a SUSIM and SSBUV instrument flown on the Shuttle. This analysis implies that spectra as shown in Figure 2 are now known to an absolute accuracy (irradiance relative to the SI scale) of 2 to 5% (wavelength dependent with larger uncertainty toward the shorter wavelengths). The reader is referred to the Woods et al. (1996) article for a full discussion and a tabulation of the irradiance values.