As a continuation of these investigations, 8 stars of spectral subtypes G1.5 - G3 were included to the observational spectrophotometric program.
Observations were done by means of the spectrophotometer installed at the 60-cm Zeiss-2 reflector of the Sternberg Institute Crimean Station. Spectral resolution is about 50 Å. The grating with discrete scanning and photomultiplier working in the regime of photon counting were used. The tests of the amplifier demonstrated its high stability. The deviation from linearity did not exceed 0.5% at counting speed of 3*105 counts/sec.
In the process of observations, the spectral width of the entrance slit was 50 Å and an inlet diaphragm of 27".5 was used. The counting time was 1 s for standard stars and 10 s for program stars at each spectral interval. Registration of spectra was done according to the scheme: standard star, program star, background, again program star, and standard star. The stars of the observational program were compared with standard stars by means of the method of equal altitudes. Differential extinction was taken into account with spectral extinction coefficients obtained on each observational night. Spectra of two standard stars, with the differences in airmass not less than 0.5, were registered several times on the night.
The energy distribution in the spectra of program stars was calculated using the nearest to the time of program star registration standard star spectrum. The background and spectral extinction coefficients of the night of observations were taken into account.
Mean energy distribution data were obtained for each star on the basis of measurements on 2-5 nights, i.e., 4-5 individual scans were used because on each night the spectrum of program star was scanned twice. Because of the inconvenience of operating with energy distribution data in instrumental wavelength system the mean energy distribution was recalculated for 50 Å steps beginning from 3425 Å.
Eight bright stars spread across the sky more or less uniformly were used as standards : beta Ari, gamma Ori, beta Tau, alpha Leo, eta UMa, alpha Lyr, alpha Aql, alpha Peg. These stars served as standards for the spectrophotometric catalog of the Sternberg Astronomical Institute. Spectral energy distribution data of standard stars with 100 Å steps are presented in the paper by Glushneva et al. (1992). All the data are reduced to the scale of the Vega energy distribution based on the data obtained by D. S. Hayes (1985). ,p> Table 1 contains HD and BS numbers of investigated stars, their spectral types, V magnitudes and color indices W-B, B-V and V-R from the WBVR catalog (Kornilov et al., 1991). The spectral type of BS 7504 (16Cyg B) was taken according to classification by Garcia (1989). The last three lines of Table 1 include the same color indices calculated for the Sun and for the mean G2 V star.
| HD | BS | SP | V | W-B | B-V | V-R | (B-V)syn | Notes | |||||||||||||||||||||||||||||||||||||||||||||||||||||||||||||||||||||||||||||||||||||||||||||||||||
|---|---|---|---|---|---|---|---|---|---|---|---|---|---|---|---|---|---|---|---|---|---|---|---|---|---|---|---|---|---|---|---|---|---|---|---|---|---|---|---|---|---|---|---|---|---|---|---|---|---|---|---|---|---|---|---|---|---|---|---|---|---|---|---|---|---|---|---|---|---|---|---|---|---|---|---|---|---|---|---|---|---|---|---|---|---|---|---|---|---|---|---|---|---|---|---|---|---|---|---|---|---|---|---|---|---|---|---|
| 10307 | 483 | G1.5 V | 4.965 | -0.049 | 0.623 | 0.499 | 0.629 | - | |||||||||||||||||||||||||||||||||||||||||||||||||||||||||||||||||||||||||||||||||||||||||||||||||||
| 186408 | 7503 | G1.5 V | 5.986 | -0.004 | 0.659 | 0.521 | 0.659 | - | |||||||||||||||||||||||||||||||||||||||||||||||||||||||||||||||||||||||||||||||||||||||||||||||||||
| 89010 | 4030 | G1.5 IV-V | 5.968 | 0.036 | 0.668 | 0.529 | 0.683 | - | |||||||||||||||||||||||||||||||||||||||||||||||||||||||||||||||||||||||||||||||||||||||||||||||||||
| 34411 | 1729 | G1.5 IV-V | 4.705 | -0.033 | 0.622 | 0.499 | 0.618{*} | -
| 146233 | 6060 | G2 Va | 5.499 | -0.028 | 0.650 | 0.524 | 0.643 | -
| 1835 | 88 | G2 V | 6.402 | 0.034 | 0.660 | 0.537 | 0.670 | -
| 213575 | - | G2 V | 6.951 | 0.004 | 0.677 | 0.538 | 0.663 | -
| 117176 | 5072 | G2.5 Va | 4.973 | 0.075 | 0.727 | 0.574 | 0.714{*} | -
| 217014 | 8729 | G2.5 IVa | 5.459 | 0.055 | 0.676 | 0.517 | - | -
| 186427 | 7504 | G3 V | 6.244 | 0.008 | 0.671 | 0.531 | 0.674 | -
| 193664 | 7783 | G3 V | 5.932 | -0.128 | 0.601 | 0.497 | 0.634 | -
| SUN | - | G2 V | - | -0.056 | 0.674 | 0.505 | - | KGKa
| Stars | - | G2 V | - | -0.045 | 0.640 | 0.523 | - | KKb
| - | - | (mean) | - | (0.054) | (0.037) | (0.032) | - | -
| - | - | - | - | 0.001 | 0.660 | - | - | Gc
| |
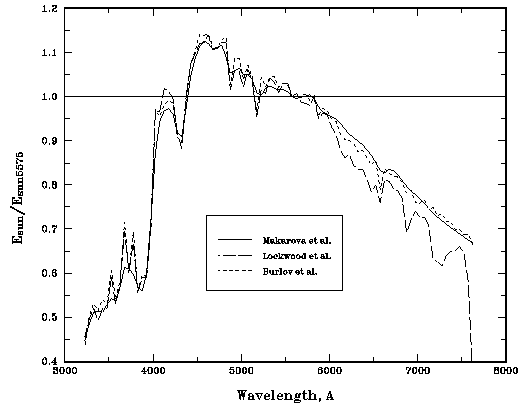
For calculation of the synthetic color indices of the Sun energy distribution was used according to the data of the monograph by Makarova et al. (1991). This monograph contains different characteristics of the Sun including energy distribution for the center of solar disk and the mean all over the disk obtained by means of calculating of average values of the best observations chosen on the basis of spectral analysis. The spectral resolution is 50 Å in the range 3000 - 5000 Å and 100 Å from 5000 to 7000 Å. In the range 7000 - 9000 Å, data are presented with 200 Å steps. These energy distribution data were also published in the Solar Physics (Makarova et al., 1994).
Response curves of the WBVR photometric system were taken from the catalog by Kornilov et al. Synthetic color indices obtained were published in the paper by Kharitonov, Glushneva & Knyazeva (1994).
W-B indices for the mean G2 V star are strongly dependent on the set of stars of this spectral subtype used for obtaining of average W-B. So, Kharitonov & Knyazeva (1997, in preparation) used G2 V stars from the Catalog of Bright stars with spectrophotometric data available. However for some of these stars spectral types are different in various sources.
Mean square roots characterizing scattering of color indices of stars are presented in parentheses.
In the last line of Table 1 mean W-B and B-V indices are presented for G2 V stars according to homogeneous spectral classification by Garcia (Glushneva, 1994).
The scatter of W-B for the stars of Table 1 is maximal (about 0.20 mag) for the B-V and V-R indices, which are about 0.12 mag and 0.08 mag.
The eighth column of Table 1 includes synthetic color indices (B-V) calculated on the basis of observed energy distribution data. Response curves were taken from the catalog by Kornilov et al. The comparison of observed and synthetic B-V indices shows that they are in a very good agreement : the mean difference (B-V)syn - (B-V)obs is only 0.m006. Two stars (BS 1729 and BS 5072) were observed earlier and are the members of the catalog of the Sternberg Astronomical Institute (Voloshina et al., 1982) and Astrophysical Institute (Alma-Ata, Kazakhstan; Kharitonov et al., 1988). (B-V)syn for these stars, marked by the asterisk in Table 1, is the mean for (B-V)syn obtained on the basis of spectrophotometric data of Moscow and Alma-Ata catalogs (Glushneva, 1994).
Table 2, from the paper by Glushneva (1994), contains observed color indices W-B and B-V for G - stars. The spectral classification by Garcia was used.
| SP | W-B | B-V | n |
|---|---|---|---|
| G0 | -0.101 | 0.605 | 8 |
| G1 | -0.124 | 0.612 | 2 |
| G1.5 | -0.126 | 0.641 | 2 |
| G2 | 0.001 | 0.660 | 2 |
| G2.5 | 0.028 | 0.674 | 2 |
| G3 | 0.042 | 0.674 | 2 |
| G4 | 0.067 | 0.726 | 2 |
| G5 | 0.023 | 0.674 | 1 |
| G8 | 0.064 | 0.748 | 3 |
| Sun | -0.055 | 0.674 | (Makarova et al.) |
| Sun | -0.071 | 0.650 | (Lockwood et al.) |
| Sun | -0.076 | 0.662 | (Burlov-Vassil'ev et al.) |
The last three lines of this table present synthetic color indices W-B and B-V of the Sun according to energy distribution data from the monograph by Makarova et al. and from the papers by Lockwood et al. (1992) and Burlov - Vassil'ev et al. (1994).
The energy distribution of the Sun was obtained by Lockwood et al. on the basis of observations at Lowell observatory by means of the comparison with the energy distribution of Vega, obtained by the same authors using models of blackbodies with melting points of platinum and copper. The spectral resolution is 4 Å.
The observations by Burlov - Vassil'ev et al. were produced at the mountain Terskol (3100 m above sea level) located at the North Caucasus. Their equipment was investigated carefully and special attention was paid to the atmospheric extinction determination and its stability control. Absolute calibration was made by means of two ribbon lamps. The comparisons were produced with the State primary etalon (Moscow) and the standard of World Radiation Center in Davos. These comparisons showed that the error of absolute calibration does not exceed 2% in the range 3000 - 7000 Å.
Energy distribution data are presented with 50 Å step in the range 3325 - 6675 Å (Burlov - Vassil'ev et al. 1994) and in the range 6500 - 10700 Å (Burlov - Vassil'ev et al. 1996).
Comparison of the mean energy distribution data over the entire solar disk normalized to 5575 Å according to three sets described above shows that in the ultraviolet region these data of different authors are in satisfactory agreement but in the red, the data by Lockwood et al. are higher. Probably it may be connected with the difference of spectral resolution, because these data were transformed to the resolution of 50 Å to make all three sets comparable.
Comparison of W-B indices of G2 V stars and the Sun from the Table 2 demonstrates that W-B of the Sun according to the data of all the authors corresponds to the earlier than G2 spectral subtype (between G1 and G1.5). The mean ratios of the monochromatic fluxes from the Sun to the fluxes from solar type stars in the range 3500 - 7500 Å are presented in Table 3.
| Wavelength range | HD 213575 | BS 88 | BS 483 | BS 4030 | BS 6060 | BS 7503 | BS 7504 | BS 7783 |
|---|---|---|---|---|---|---|---|---|
| 3425-3575 | 0.997 | 0.919 | 1.044 | 0.930 | 1.009 | 0.927 | 0.924 | 1.022 |
| 3625-3975 | 0.996 | 0.965 | 1.099 | 0.968 | 0.985 | 0.987 | 0.951 | 1.057 |
| 4025-4475 | 1.010 | 1.005 | 1.039 | 1.009 | 1.032 | 1.009 | 0.991 | 1.020 |
| 4525-4975 | 0.991 | 1.001 | 1.012 | 0.984 | 1.017 | 0.997 | 0.995 | 0.998 |
| 5025-5475 | 1.002 | 1.004 | 1.004 | 1.004 | 1.008 | 0.999 | 0.997 | 0.993 |
| 5525-5975 | 0.988 | 1.007 | 0.991 | 0.986 | 0.985 | 0.994 | 0.997 | 0.972 |
| 6025-6475 | 0.981 | 1.003 | 0.951 | 1.008 | 0.965 | 0.970 | 0.976 | 0.955 |
| 6525-6975 | 1.011 | 1.041 | 0.957 | 1.061 | 0.980 | 0.992 | 1.001 | 0.975 |
| 7025-7525 | 1.003 | 1.023 | 0.974 | 1.082 | 0.968 | 0.978 | 0.993 | 0.993 |
| Mean | 0.998 | 0.996 | 1.008 | 1.004 | 0.994 | 0.984 | 0.981 | 0.998 |
| Wavelength range | HD 213575 | BS 88 | BS 483 | BS 4030 | BS 6060 | BS 7503 | BS 7504 | BS 7783 |
|---|---|---|---|---|---|---|---|---|
| 3425-3575 | 0.979 | 0.903 | 1.026 | 0.919 | 0.991 | 0.910 | 0.908 | 1.005 |
| 3625-3975 | 0.970 | 0.940 | 1.071 | 0.940 | 0.959 | 0.962 | 0.926 | 1.030 |
| 4025-4475 | 0.981 | 0.977 | 1.009 | 0.980 | 1.004 | 0.980 | 0.963 | 0.992 |
| 4525-4975 | 0.991 | 1.000 | 1.011 | 0.983 | 1.017 | 0.996 | 0.995 | 0.997 |
| 5025-5475 | 1.003 | 1.006 | 1.005 | 1.005 | 1.010 | 1.000 | 0.998 | 0.994 |
| 5525-5975 | 0.997 | 1.016 | 1.000 | 0.995 | 0.994 | 1.003 | 1.006 | 0.980 |
| 6025-6475 | 1.047 | 1.069 | 1.014 | 1.075 | 1.029 | 1.035 | 1.041 | 1.018 |
| 6525-6975 | 1.077 | 1.109 | 1.019 | 1.130 | 1.043 | 1.056 | 1.066 | 1.039 |
| 7025-7525 | 1.095 | 1.117 | 1.064 | 1.182 | 1.057 | 1.068 | 1.085 | 1.084 |
| Mean | 1.016 | 1.015 | 1.024 | 1.023 | 1.012 | 1.001 | 0.999 | 1.015 |
| Wavelength range | HD 213575 | BS 88 | BS 483 | BS 4030 | BS 6060 | BS 7503 | BS 7504 | BS 7783 |
|---|---|---|---|---|---|---|---|---|
| 3425-3575 | 0.953 | 0.879 | 1.000 | 0.904 | 0.965 | 0.886 | 0.885 | 0.979 |
| 3625-3975 | 0.955 | 0.926 | 1.055 | 0.926 | 0.945 | 0.948 | 0.912 | 1.015 |
| 4025-4475 | 0.987 | 0.983 | 1.015 | 0.986 | 1.010 | 0.986 | 0.969 | 0.998 |
| 4525-4975 | 0.979 | 0.988 | 0.999 | 0.971 | 1.004 | 0.984 | 0.982 | 0.985 |
| 5025-5475 | 0.994 | 0.997 | 0.997 | 0.996 | 1.001 | 0.991 | 0.989 | 0.986 |
| 5525-5975 | 0.988 | 1.007 | 0.991 | 0.986 | 0.985 | 0.993 | 0.997 | 0.972 |
| 6025-6475 | 0.999 | 1.021 | 0.968 | 1.027 | 0.982 | 0.988 | 0.994 | 0.972 |
| 6525-6975 | 1.023 | 1.054 | 0.968 | 1.073 | 0.991 | 1.003 | 1.013 | 0.987 |
| 7025-7525 | 0.994 | 1.015 | 0.966 | 1.072 | 0.960 | 0.970 | 0.985 | 0.984 |
| Mean | 0.986 | 0.986 | 0.995 | 0.993 | 0.983 | 0.972 | 0.970 | 0.986 |
Since energy distributions of the Sun and stars were normalized to the fluxes at 5575 Å, maximal differences of these data are in the ultraviolet and near infrared ranges.
For BS 88, BS 4030, BS 7503 and BS 7504 monochromatic fluxes in the range 3400 - 4000 Å are less than solar ones for the solar data by all three groups of authors. It indicates lower temperature of these stars relative to the solar one.
Taking into account the accuracy of solar and stellar energy distribution in the ultraviolet (~ 2% in each case) the differences of the mean ratio relative to 1.00 as large as 3% or more may be considered to be significant.
The energy distributions of HD 213575, BS 483, BS 6060 and BS 7783 are nearer to the solar one than in the case of stars mentioned above.

FIGURE 1:The energy distribution of the Sun normalized to 5575 Å.
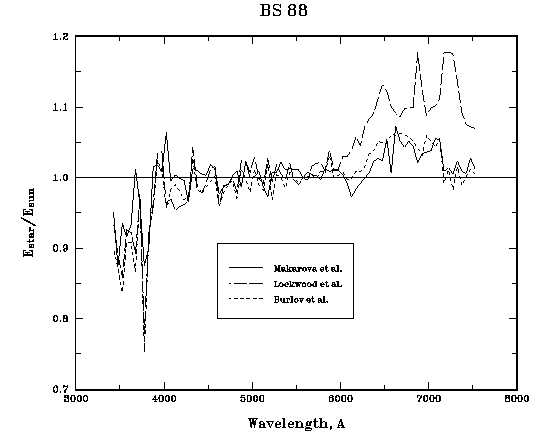
FIGURE 2:The ratio of the monochromatic fluxes from BS 88 to the fluxes from the Sun in the range 3400 - 7000 Å.
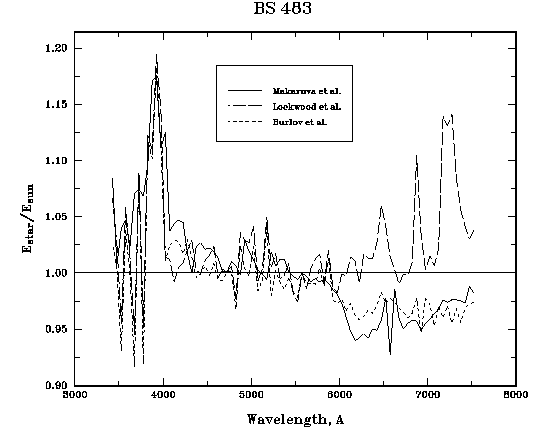
FIGURE 3:The ratio of the monochromatic fluxes from BS 483 to the fluxes from the Sun in the range 3400 - 7000 Å.
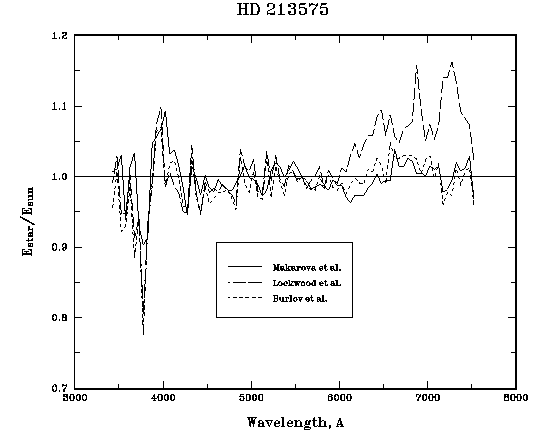
FIGURE 4:The ratio of the monochromatic fluxes from BS 2135 to the fluxes from the Sun in the range 3400 - 7000 Å.
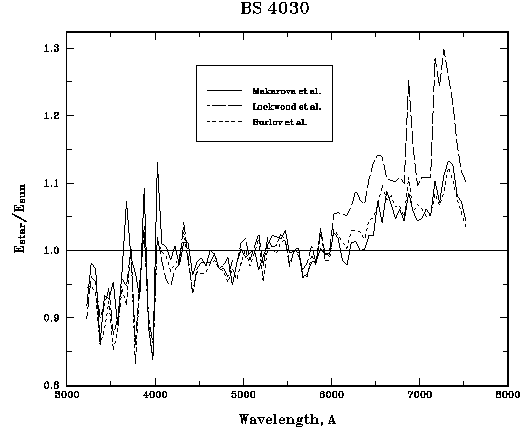
FIGURE 5:The ratio of the monochromatic fluxes from BS 4030 to the fluxes from the Sun in the range 3400 - 7000 Å.
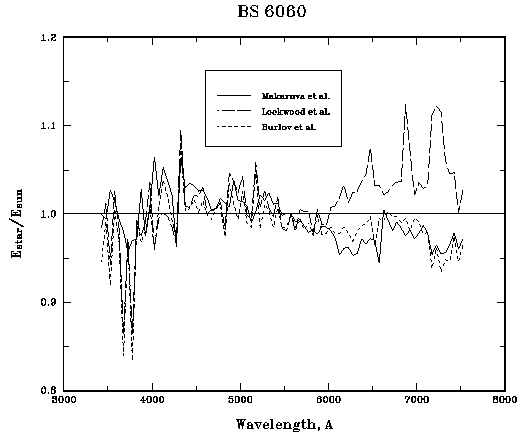
FIGURE 6:The ratio of the monochromatic fluxes from BS 6060 to the fluxes from the Sun in the range 3400 - 7000 Å.
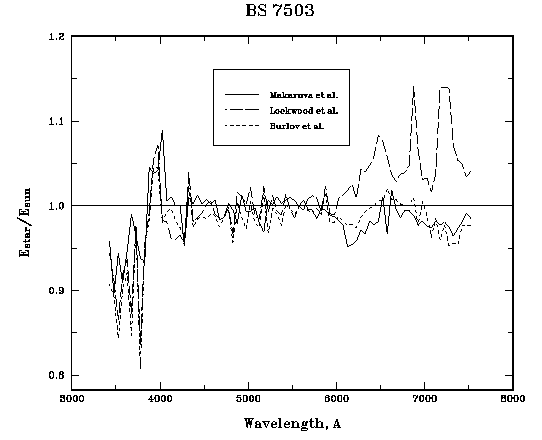
FIGURE 7:The ratio of the monochromatic fluxes from BS 7503 to the fluxes from the Sun in the range 3400 - 7000 Å.
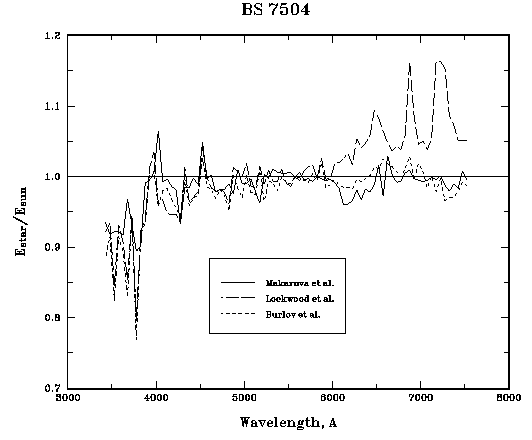
FIGURE 8:The ratio of the monochromatic fluxes from BS 7504 to the fluxes from the Sun in the range 3400 - 7000 Å.
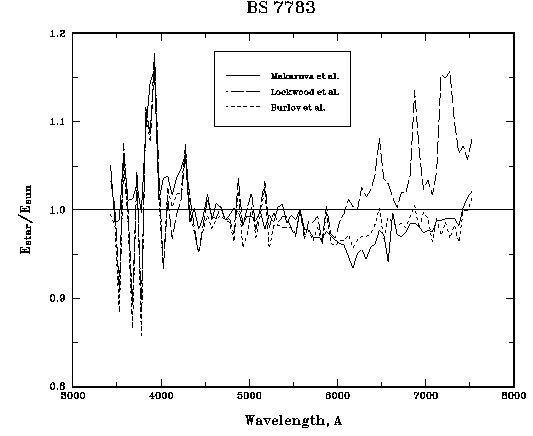
FIGURE 9:The ratio of the monochromatic fluxes from BS 7783 to the fluxes from the Sun in the range 3400 - 7000 Å.