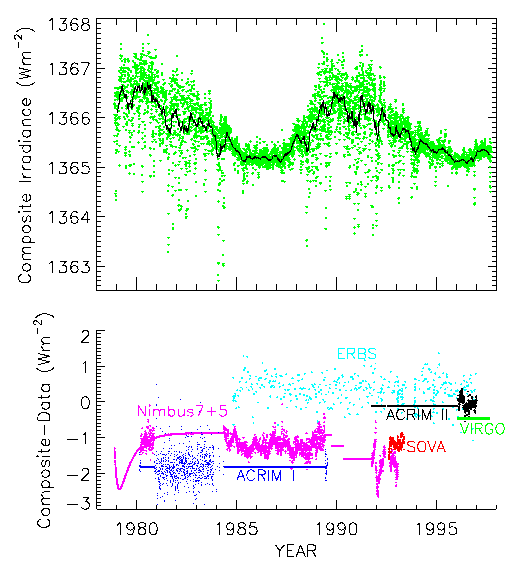
FIGURE 2: Measurements of total irradiance from seven space-based radiometers (bottom panel) and their composite (top panel). The daily observations are in green and a 81-day running mean is shown by the dark, solid curve. The Nimbus 7 data are adjusted by 5 W m-2. From Fröhlich and Lean (1997) and Lean and Fröhlich (1998). (Courtesy J. Lean.)
Variations on three time scales are seen in the composite total irradiance record: the solar cycle, pulses of activity (2-12 months), and the 27-day rotational modulation. The level of total irradiance is essentially the same for the two observed minima, and the amplitude of the solar cycle variation is slightly less than 0.1% (Fröhlich and Lean, 1997; Lean and Fröhlich, 1998). The variations on shorter times scales (days to months) are larger, a few tenths of a percent.
The variations in total irradiance are primarily the result of dark sunspots, which decrease the total irradiance, and bright faculae and network, which increase the total irradiance. The long-term variation that is in phase with the solar cycle is related to the total surface area of the bright faculae and the network increasing in the rise of a cycle and decreasing in the cycle's decline, as well as to the long lifetime (months) of the faculae and network, which are made up of dispersing active region magnetic fields. The short-time scale variations superimposed on the long-term cycle variation arise from the emergence and evolution of active region plage (brighter faculae) and sunspots modulated by the 27-day rotation period of the Sun. These effects are largest during periods of high activity.
In detail, the effect of faculae, the network, and sunspots on the total irradiance depends on four factors: their spatial distribution, area, lifetime, and contrast. The passage of sunspots and faculae across the solar disk causes changes in the irradiance on a day-by-day basis dependent on their area and position. Because of their longer lifetime, faculae and the network dominate the irradiance variations on time scales of weeks to months. The contrast is a more complicated function. It is related to the center-to-limb variation in the intensity of a structure relative to the photospheric background, and for sunspots also to area, its umbral and penumbral structure, and possibly the phase of the cycle. Empirical models of the irradiance effect of sunspots, called the sunspot blocking function (Foukal 1981; Lean et al., 1998) or the photometric sunspot index (Fröhlich et al., 1994; Chapman et al., 1996; Steinegger et al. 1996), have been developed, but taking only some of these factors into account. For faculae and network (white-light), their irradiance contribution network is based on established relations between their chromospheric and photospheric counterparts (Lean et al., 1998; Lean and Fröhlich, 1998).
A comparison of simulations of the sunspot and facular contributions to total irradiance and of their combined effect in relation to the composite total irradiance record is shown in Figure 3. Empirical models of the these two components can account for 88% of the solar total irradiance over the span of the observations (Lean and Fröhlich, 1998). The simulated irradiance tracks the cycle variation in the composite total irradiance and has similar levels during the 1986 and 1996 minima. While the variations on shorter time-scales are similar, there are significant differences in their details. These departures appear to be related to differences between the center-to-limb contrasts of the proxy chromospheric structures and the corresponding photospheric faculae, and to the limitations of a two-component model. Such differences need to be reconciled to eventually produce reliable proxies of the sources contributing to the Sun's variability.
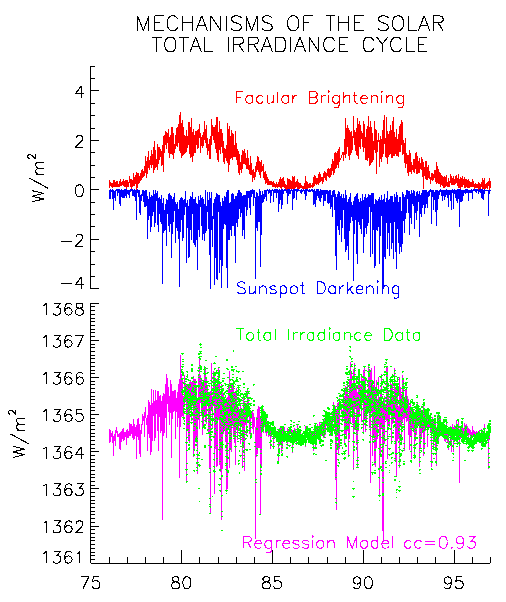
FIGURE 3: Estimates of the facular brightening and sunspot darkening contributions to total irradiance variability are compared in the upper panel during cycles 21 and 22. Their sum, shown in the lower panel, accounts for 88% of the variance in the composite solar total irradiance record, shown by the green symbols. From Lean and Fröhlich (1998). (Courtesy J. Lean.)
Most of the sun-as-a-star measurements taken on a synoptic basis are made within narrow spectral bands and in spectral lines. These data tend to show much larger variations over a solar cycle than seen or modeled over wider wavelength bands, as shown in Figure 4.
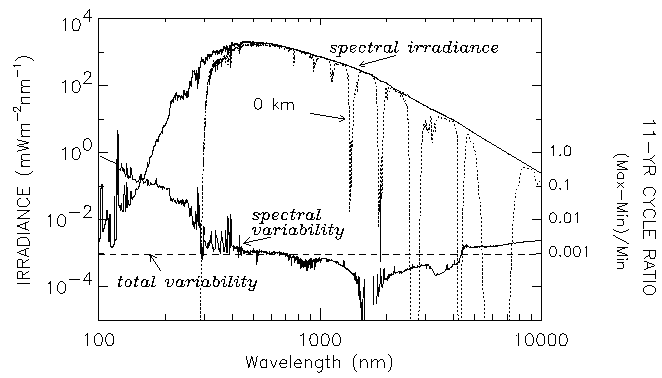
FIGURE 4: The spectrum of solar irradiance incident at the top of the Earth's atmosphere and at the Earth's surface (dotted curve). An estimate of the solar spectrum variability during the 11-year activity cycle with wavelength is compared with that of total irradiance (dashed line). From Lean and Fröhlich (1998). (Courtesy J. Lean.)
Table 1 summarizes many of the disk-integrated measures of solar activity and Table 2 of solar images that are currently available as part of synoptic programs at observatories around the world. Although the lists are not be complete, they indicate the variety of data that are taken on a regular basis in order to follow, as well as understand, the variations in solar activity at all heights in the solar atmosphere and as a function of time.
| Measurement | Dates |
|---|---|
| Sunspot number | 1610 -- present |
| Sunspot regions: position, sunspot area | 1874 -- present |
| 10.7 cm radio flux | 1947 -- present |
| Coronal Lines: Fe IV 5303, Fe X 6374, Ca XV 5954 | 1948 -- present |
| Total magnetic flux | 1974 -- present |
| Total solar irradiance | 1980 -- present |
| Spectral Lines: e.g. Ca II K, C I 5380, Fe I 5379, Ti II 5381, He I 10830 | 1974 -- present |
Table 2. Synoptic Images of Sun, visible to radio wavelengths
| Measurement | Dates |
|---|---|
| Sunspot drawings: sunspot polarity | 1917 -- present |
| White-light | 1900 -- present |
| H alpha | 1900 -- present |
| CaII K | 1900 -- present |
| Magnetograms | 1967 -- present |
| HeI 10830 | 1974 -- present |
| 17 GHz | 1992 -- present |
The variation in solar spectral irradiance at three wavelengths -- 10.7 cm radio, HeI 10830, and CaII K -- is compared in Figure 5 with the total magnetic flux and the sunspot number from 1975 to the present. The total magnetic flux, defined as the sum of the absolute value of the positive and negative flux, is determined from the observed line-of-sight magnetic field measurements by assuming that the magnetic field is radial and correcting for the Bo annual variation (J. Harvey, private communication). The data in Figure 5, averaged by Carrington rotation to minimize the effects of rotational modulation, show two characteristic time-scales of activity: pulses of activity and the solar cycle.
The long-term variations of these five activity parameters are closely in phase. However, there are obvious differences in the amplitudes of their variations on time-scales of a few months. Solar activity occurs in pulses, which last for periods of less than 2 to around 12 months. These so-called pulses of activity result from the development of long-lived, large activity complexes, comprised of a cluster of two or more active regions that emerge within a narrow band of latitude and longitude over a period of weeks and evolve into extended large-scale patterns of unipolar magnetic flux (discussed further in Section 3). The amplitudes and shapes of the activity pulses, however, can differ between the spectral irradiance measures suggesting that these variations, while related to the emergence and evolution of active regions, involves more complicated processes and perhaps different relative contributions of the source structures to specific spectral irradiance measures.
On longer time scales, we see differences in the timings and amplitudes of cycle maximum. The active-region dominated parameters -- sunspot number, 10.7 cm radio flux, total magnetic flux -- increase by large factors, from about 3 to greater than 13, while those measuring chromospheric activity -- HeI 10830 equivalent width and the CaII K index -- increase by a smaller factor, 70% and 10% respectively. Like the variability on shorter time scale, the strong differences on this time scale point to substantial differences in the sources contributing to the observed variations.
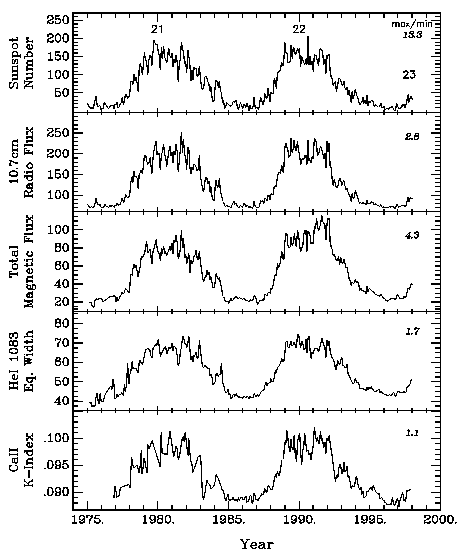
FIGURE 5: Comparison of sunspot number, 10.7 cm radio flux (Penticton/Ottawa/, total magnetic flux (NSO/KP), HeI 10830 equivalent width (NSO/KP), and the CaII K index (NSO/SP) for cycles 21, 22 and the onset of cycle 23. Each data set is averaged over intervals of a solar rotation. The italicized numbers along the right side of each plot indicate the increase in activity levels from minimum to maximum in cycles 21 and 22.}
Several techniques are now being employed to decompose images into separate activity structures, from simple threshold schemes to techniques that also take into account the spatial information and characteristics of different structures. One method, employed by Harvey and White (1996, 1998), uses simultaneous high-resolution magnetograms and continuum intensity images from NSO/KP. Measurements of the magnetic flux, polarity, presence of sunspots, pixel contiguity, Gaussian smoothing, and thresholds to separate the solar surface into six activity structures: sunspots, active regions, decaying active regions, enhanced network, network (weak and quiet) and the quiet atmosphere. The spatial masks defined through this procedure, shown in Figure 6, can be applied to spectral intensity images, such as to images of the CaII K residual intensity (determined by subtracting the limb-darkened quiet sun) and of inverse He I 10830 equivalent width images in Figures 7a, 7b. The intensity images and magnetograms are co-aligned allowing us to study the mapping function between magnetic flux density and CaII K intensity for each structure, as well as determining the contribution of individual structures to the total CaII K spectral intensity as a function of time.
There are well-defined mapping relations between CaII K mean residual intensity (the limb-darkened quiet sun is subtracted) and the magnetic flux density, as shown in Figure 8. Over a magnetic flux density range from 30 to 400 Mx/cm2, the mapping relation can be fit with a power-law. The power-law exponent is the same for for all structures but the enhanced network. For any given magnetic flux density, however, the mean CaII K residual intensity depends on the structure in which the pixel is located. For the data in Figure 8, pixels in plage, for example, are a factor of four brighter than if the pixel were located in weak network.
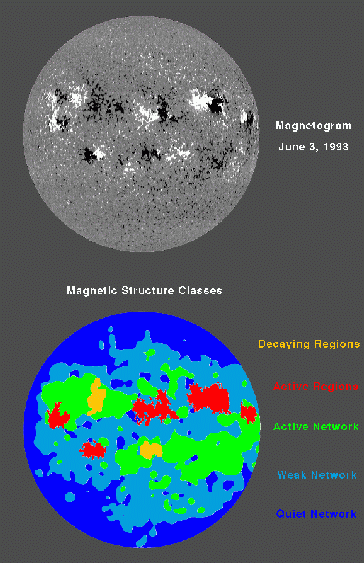
FIGURE 6: Full-disk magnetogram (top panel) and its separation into five structure classes (bottom panel). (From Harvey and White, 1996.)
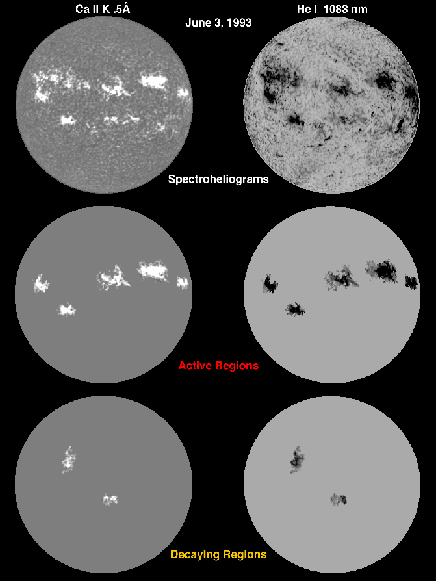
FIGURE 7: Full-disk CaII K residual intensity and He I 10830 inverse equivalent width images and the corresponding active region structures based on the masks derived from magnetograms. (From Harvey and White, 1996, 1998.)
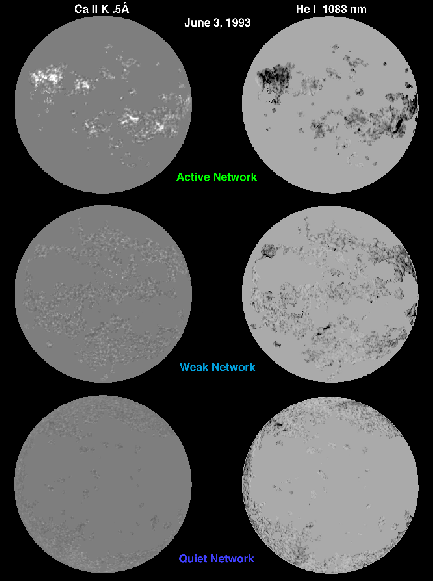
FIGURE 8: Full-disk CaII K residual intensity and He I 10830 inverse equivalent width image and the corresponding network structure structures based on the masks derived from magnetograms. (From Harvey and White, 1996, 1998.)
The relation between CaII K residual intensity and magnetic flux density also may vary over the solar cycle, as shown in Figure 9. The Sun at cycle minimum, assumed here to have no active regions or dispersing active region fields, is simulated by the mapping function for weak/quiet network and for the active sun by the mapping function for entire sun during high activity. Based on these assumption, there is significant change in the overall mapping function in the CaII K line between the minimum and maximum phases of the cycle, as shown in Figure 9.
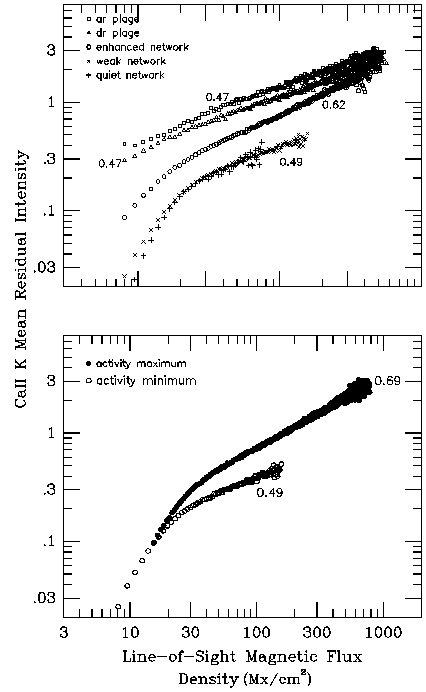
FIGURE 9: Mapping relation between magnetic flux density and mean net CaII K residual intensity for five structures as indicated in the graph (top panel). A comparison of the mapping relations for the entire Sun intensity for the Sun during the maximum of a cycle is shown in the bottom panel. Sunspots are excluded from these analyses. The numbers next to each mapping relation indicate the exponent of the best power-law fit between 30 and 400 Mx/cm2. (From Harvey and White, 1998.)
Studies of the contribution of individual structures to spectral irradiance variability indicate that the enhanced network (i.e. dispersing active regions) and the quiet network are significant and are the third component, as first suggested by Skumanich et al. (1984) and Lean (1988). How much the network contributes, however, depends on the spectral line. For example, structures represent between 30% and 50% to the Ly-alpha spectral irradiance (Fox et al., 1997), but only 18-22% in the CaII K line (White and Harvey, 1998). Active region plage is a comparatively smaller contributor in both lines, about 5%-10% during active periods. In the CaII K line, both plage and the enhanced network contribute most strongly to the 27-day modulation in irradiance, while the network is the main contributor to the long-term irradiance variation (Harvey and White, 1996; Worden et al., 1998; White and Harvey, 1998).